
- Dissertation Topics (180)
- Accounting Dissertation Topics (8)
- Banking & Finance Dissertation Topics (10)
- Business Management Dissertation Topics (35)
- Economic Dissertation Topics (1)
- Education Dissertation Topics (12)
- Engineering Dissertation Topics (9)
- English Literature Dissertation Topics (3)
- HRM Dissertation Topics (3)
- Law Dissertation Topics (13)
- Marketing Dissertation Topics (9)
- Medical Dissertation Topics (7)
- Nursing Dissertation Topics (10)
- Other Topics (10)
- Supply Chain Dissertation Topics (2)
- Research Topics (16)
- Biomedical Science (1)
- Business Management Research Topics (1)
- Computer Science Research Topics (1)
- Criminology Research Topics (1)
- Economics Research Topics (1)
- Google Scholar Research Topics (1)
- HR Research Topics (1)
- Law Research Topics (1)
- Management Research Topics (1)
- Marketing Research Topics (1)
- MBA Research Topics (1)
- Medical Research Topics (1)
- Guide (49)
- How To (27)
- List (20)
Table of Contents
CHAPTER 3: METHODOLOGY
The methodology chapter is a significant part of the research study. It provides details about the research strategy adopted by the researcher to achieve the research objectives and goals. The following methodology chapter will be highlighting the research design, approach and the research philosophy adopted by the investigator while compiling the research study. The methodology section will also be discussing the data collection and analysis technique along with providing details about the type of investigation used. Lastly, it will also be discussing the limitations faced by the researcher and the ethical guidelines considered while conducting the research.
Research Approach
Deductive research approach and the inductive research approach are the two type of research approach. Generally, any of the two types is selected based on the research design adopted (qualitative or quantitative). The deductive research approach is in close resemblance to quantifiable data and numbers and by adopting the following approach, the investigator narrows down the research objectives by framing research hypothesis whereas on the other hand, according to Edmonds & Kennedy (2012), when the researcher intends to provide a conclusion which is obtained through descriptive data and which is subjective in nature, in such situation the researcher adopts an inductive approach.
The deductive research approach has been utilized by the researcher. As discussed above that the deductive is more commonly and appropriately used simultaneously with the quantitative research design, thus the researcher adopted the following approach. The researcher had generated the hypotheses in the initial phases of the research and as per Bryman (2016), the deductive approach is when the hypothesis is formulated to begin the research with, therefore considering this context, the deductive approach was utilized.
The researcher in this study had applied the positivism philosophy. As the positivism philosophy, according to Csiernik & Birnbaum (2017), revolves around proposing a conclusion that is analysed using different statistical techniques and in such philosophy, quantitative data is used. Thus in light of the arguments or definition proposed by Csiernik & Birnbaum (2017), the positivism philosophy was more appropriate and suitable. Secondly, the interpretivism philosophy does not see to fit here according to Tuli (2010), this philosophy is applied when the conclusion is presented as an opinion or perspective of various authors or participants.
Sample and Data Sources
The data collection method which is utilized in the research is of two types; primary and secondary. The following research study had utilized the secondary data collection method. This study has used sample of 150 non-financial firms listed on the Karachi Stock exchange over period of 2006 to 2016. The nature of the topic was such that secondary data collection suited the best. As the study is related to financial distress and CSR performance which are both a part of the annual reports, thus secondary method was chosen. Secondly to attain primary data from 200 companies’ owners or employees from the last ten years would have been a difficult and a timeconsuming process, therefore, the secondary data collection method was the best option in this situation.
Variables of the Study
Dependent Variable
Financial distress is dependent variable for this research study. The data gathered from the 150 public companies portray the level of financial distress within the companies. Financial distress has been measured with the help of Altman’s Z score. The following test utilizes 5 financial ratios of a firm to categorize them into financially constrained and unconstrained firms.
The following formula will represent the Altman’s Z-score for a firm: Altman’s Z-score = 1.2X1 + 1.4X2 + 3.3X3 +0.6X4 + 0.999X5
Where:
X1 = Cash ratio minus Trade payables ratio; this is the sum of cash and cash equivalents minus the trade payables divided by the total assets to measure the liquidity of the firm.
X2 = Retained earnings/total assets; the retained earnings represent net earnings not paid out as dividends, but retained by the company to be reinvested in its core business or to pay debt.
X3 = earnings before interest and taxes/total assets; this is a ratio that measures a company’s earnings before interest and taxes (EBIT) against its total net assets.
X4 = book value of equity/book value of total liabilities; this is a financial ratio indicating the relative proportion of shareholders’ equity and debt used to finance a company’s assets.
X5 = sales/total assets; this ratio measures the ability of the firm to generate revenues using its assets. The higher the ratio of sales to total assets, the more efficiently the company is run and the better company leadership is at managing assets.
The Altman Z-score provides zones of discrimination for interpretation; however we divide the score into three quartiles. The highest quartile corresponds to firms that are financially unconstrained while the lowest quartile corresponds to firms with financial constraints.
The five financial ratios utilized by the test are working capital ratio/total assets, retained earnings/total assets, earnings before interest/total assets, the market value of equity/total assets and sales/total assets.
Independent Variables
Corporate social responsibility performance and the firm’s life cycle are the independent variables in this study. As there is lack of evidence and research regarding the measurement and disclosure of CSR by the firms in Pakistan neither in percentage nor in the form of variables such as environmental compliance (EC) or corporate governance (CG), therefore, to measure CSR performance of firms, the variable of ‘social investment’ had been used.
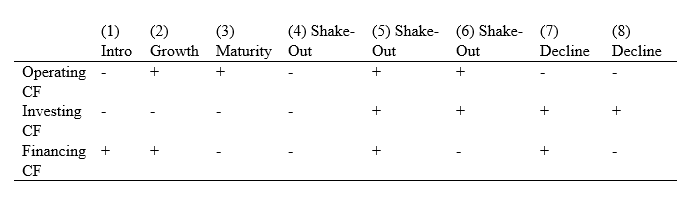
The Firm’s life cycle is measured by the five-stage life cycle model proposed by
Dickinson (2011). The five significant life cycle stages are introduction, growth, maturity, shakeout and Decline. The table below represents the cash flow pattern-based classification scheme of life-cycle stages. The life-cycle measure in this research is based on a three-year moving average of the net cash flows:
Control Variables
The control variables that were a part of this study are firm size, cash holding, leverage, liquidity, research and development strength, profitability and year effects.
Data Analysis
Data collected from the annual financial reports will be analyzed using the ordinary least squares (OLS) regression model. The formula for the model is depicted below:
𝐷𝐷𝐷𝑖,𝑡 = 𝛼0𝑖𝑡° + 𝛽1𝐶𝐷𝐶𝑖𝑡 + 𝛽2𝐷𝐷𝑆𝐸𝑖𝑡 + 𝛽3𝐿𝐸𝐿𝑖𝑡 + 𝛽4𝐶𝐶𝐷𝐶𝑖𝑡 + 𝛽5𝐶𝑅𝐶𝑖𝑡 + 𝛽6𝑘𝑖𝑡 + 𝛽7𝐿𝑅𝐷𝐷𝑖𝑡 + 𝛽8𝐷𝐼𝐷𝑖𝑡 + 𝜖𝑖𝑡
The above equation represents the model of regression in which the “DIS” represents the financial distress if the firm whereas “i” is the firms whereas “t” represents the financial years 2006 – 2016 that had been measured through applying Altman’s Z-score. The other variables that are highlighted in the equation are CSR which represents corporate social responsibility; Size shows the natural logarithm of total assets, LEV is measured through ratio analysis in which the short-term and long-term debt divided by total assets. The variable CASH indicates the cash holdings by the firm defined as cash and marketable securities scaled by total assets, ROA represents the return on assets which is a determined through ratio analysis, K variable represents cash plus receivables/current liabilities, LOSS indicates Dummy variable scored as 1 if the firm is a loss-making firm in a given year, IND factor shows the industry sector dummy variable, coded 1 if the firm is represented in the particular GICS category, otherwise 0 and lastly, YEAR shows the year dummy variable, coded 1 for a particular year, otherwise 0 and e = the error term. i = firms 1–150. t = financial years 2006–2016.
DIS = financial distress (Altman’s Z-score)
CSR = either POS_CSR or NEG_CSR
SIZE = the natural logarithm of total assets
LEV = short-term and long-term debt divided by total assets
CASH = cash holdings by the firm defined as cash and marketable securities scaled by total assets
ROA = return on assets
K = cash plus receivables/current liabilities
LOSS = Dummy variable scored as 1 if the firm is a loss-making firm in a given year
IND = industry sector dummy variable, coded 1 if the firm is represented in the particular GICS category, otherwise 0
YEAR = year dummy variable, coded 1 for a particular year, otherwise 0 and e = the error term.
The extended OLS regression model utilized to examine the relationship between financial distress, CSR performance and firm life cycle stages are:
𝐷𝐷𝐷𝑖,𝑡 = 𝛼0𝑖𝑡° + 𝛽1𝑙𝑙𝑙𝑙𝑙𝑙𝑙𝑙𝑖𝑡 + 𝛽2𝐷𝐷𝑆𝐸𝑖𝑡 + 𝛽3𝑑𝑑𝑖𝑡 + 𝛽4𝑙3𝑖𝑡 + 𝛽5𝐶𝑅𝐶𝑖𝑡 + 𝛽6𝐼𝑁𝐶𝑖𝑡 +
𝛽7𝑙𝑐𝑐𝑐𝑐 + 𝜖𝑖𝑡 (3.1)
where i = firms 1–150; t = financial years 2006–2016; DIS = financial distress (Altman Z); logofcsr = either POS_CSR or NEG_CSR; size = the natural logarithm of total assets; LEV = financial leverage short-term and long-term debt divided by total assets; dv = cash holdings by the firm defined as cash and marketable securities scaled by total assets; ROA = return on assets; NWC = net working capital; CAPEX = Proportion of fixed assets in total assets – Control Variable.
Our extended OLS regression model used to investigate the association between financial distress, CSR performance and firm life cycle stages is estimated as follows:
𝐷𝐷𝐷𝑖,𝑡 = 𝛼0𝑖𝑡° + 𝛽1𝑙𝑙𝑙𝑙𝑙𝑙𝑙𝑙𝑖𝑡 + 𝛽2𝐿𝐿𝑙𝑐 𝐶𝐶𝑙𝑙𝑐𝑖𝑡 + 𝛽3𝑙𝑙𝑙𝑙𝑙𝑙𝑙𝑙𝑖𝑡 ∗𝐿𝐿𝑙𝑐 𝐶𝐶𝑙𝑙𝑐 + 𝛽4𝐷𝐷𝑆𝐸𝑖𝑡
+ 𝛽5𝑙3𝑖𝑡 + 𝛽6𝑑𝑑𝑖𝑡 + 𝛽7𝐶𝑅𝐶𝑖𝑡
+ 𝛽8𝐶𝑅𝐶𝑖𝑡 + 𝛽9 𝐼𝑁𝐶𝑖𝑡 + 𝛽9 𝑙𝑐𝑐𝑐𝑐𝑖𝑡
+ 𝜖𝑖𝑡 (3.2)
Where Life Cycle = Dickinson life cycle model measured as retained earnings scaled over CSR * Life Cycle = an interaction term comprising the life cycle variable multiplied by CSR.
View More Samples


 WhatsApp Now
Get Instant 50% Discount on Live Chat!
WhatsApp Now
Get Instant 50% Discount on Live Chat!